
I’ve worked with dozens of SecOps and Detection and Response teams over the past few years and it has become crystal clear to me how important it is to fix as many security issues as possible upstream. Or as it is more commonly known, “Shift Left Security”. Broadly, I see three camps on “Shift Left Security” — 1) don’t understand it, 2) get it, not executing it, 3) get it, executing it. You might be in that third camp and think shifting left is obvious and common knowledge. Let me humbly remind you it is a big world out there, and the average organization is woefully immature on security. Put another way, camps one and two combined vastly outnumber camp three.
 Why is that? Well “Shift Left Security” is new-ish, but more importantly it is hard. It is like consistently eating vegetables in the face of other sugary temptations. Security vendors all say shifting left enables faster delivery and lower costs, but in my opinion, never meaningfully quantify it. In this analysis, I am going to attempt to arm practitioners with data on “Shift Left Security” that every executive and controller of budget will understand — business economics. This fits into an important broader theme of the need to frame security about driving business results — growing your TAM, accelerating sales cycles, shipping product faster — not just acting as a risk reduction exercise.
First, a definition to level set. To do “Shift Left Security” means to move security up early and often in the Organization’s Development Lifecycle, which I would define as a superset of the usual Software Development Lifecycle. This includes everything to do with employees, vendors, security controls, and digital footprint of an organization. Security issues prevented or discovered earlier, before they propagate throughout an organization, are easier and cheaper to implement.
Now for the analysis. In my opinion, this subject is too complicated to do some high level analysis and claim something like “shifting left makes you 10% faster and saves you 30%”, there are too many variables. My approach will be modeling very specific, micro examples of a hypothetical organization shifting left, and see what can be learned from that.
On the parameters in the models below — there are some very rough estimations (or even complete guesstimates in places) that I attempt to pull together when the available data is poor. Read the sources for my commentary, and let me know if you know of more trustworthy research! Additionally, “Data Breaches” are not the only form of cyber events to worry about, I anchored on them because there is solid research around costs compared to more nebulous effects of brand, trust, etc.
Model 1 — MFA Implemented Across The Organization
Starting simple. If you are thinking “every organization has MFA enabled everywhere”, you need a reality check. Nevertheless, MFA as a single control deployed across an organization is a great intuitive example. MFA is considered shifting left because it prevents many risky credential behaviors from ever being possible in the first place. This model compares a hypothetical organization with MFA deployed everywhere properly, versus one that only uses 1FA.
Model Costs:
- SOC Personnel Costs = (Login Alerts Per User Per Day Related To 1FA Only) * (Organization Size) * (Average Annual SOC Analyst Cost) / (Alerts Triaged Per Analyst Per Day)
- SOC Software Costs = (Login Alerts Per User Per Day Related To 1FA Only) * (Organization Size) * (Per Alert Software Cost To Aid In Investigation) * (365 Days)
- Dollar Loss Of Productivity = (Average Number Of MFAs Per Day Per User) * (Organization Size) * (Time To MFA In Seconds) / (1 Minute / 60 Seconds) / (1 Hour / 60 Minutes) / (1 Day / 24 Hours) * (Average Annual Employee Cost)
- Expected Value Of Breach Cost = (Average Cost Of Data Breach) * (Likelihood Of Data Breach)
Model Parameters:
- Organization Size: 10000 Employees (Users)
- Time To MFA (Google Auth Or Equivalent): 10 Seconds [1]
- Average Number Of MFAs Per Day Per User: 1 [2]
- Average Annual Employee Cost: $100,000
- Login Alerts Per User Per Day Related To 1FA Only (Anomalous Access, Password Sharing, etc.): 0.01 [3]
- Alerts Triaged Per Analyst Per Day: 100 [4]
- Average Annual SOC Analyst Cost: $100,000
- Per Alert Software Cost To Aid In Investigation: $0.10 [5]
- Percent Of Data Breaches As A Result Of Stolen Or Compromised Credentials: 19% [6]
- Average Cost Of Data Breach: $4.35M [7]
- Base Likelihood Of Data Breach: 1.13% [8]
- Likelihood Of Data Breach With MFA: 0.92% [9]
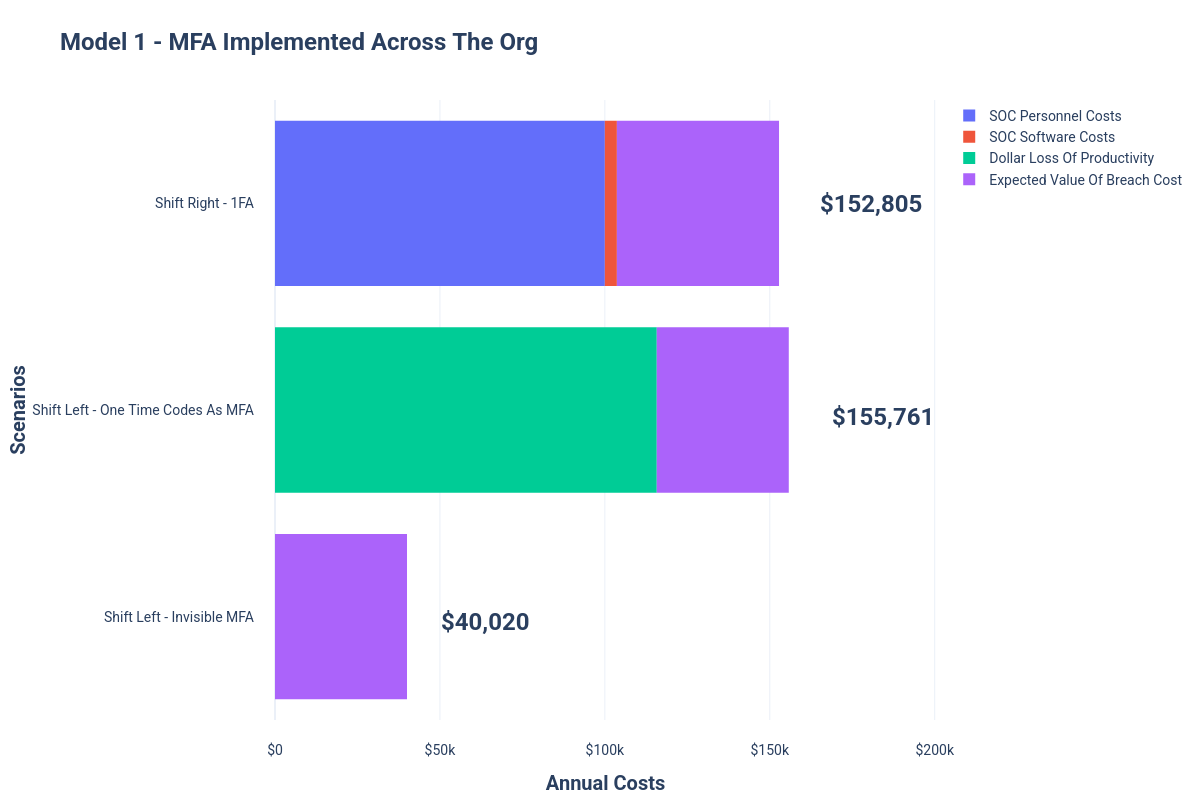
Honestly I was a little surprised how much the friction of traditional MFA added up in terms of dollars from this analysis. All the more reason to adopt invisible MFA solutions.
Model 2 — DevSecOps Properly Executed
DevSecOps is probably the most well developed category of “Shift Left Security”, and there are a number of great tools focused on application or infrastructure security testing. Great here looks like tooling embedded into the developer workflow without friction. Bad, or security kept to the right, looks like a security team disjointed from development and finding security issues after things have been shipped to production. This model compares an organization conducting software development with DevSecOps deployed to its fullest, versus one that takes a purely reactive approach to software security.
Model Costs:
- Developer Costs = (Distinct Production Applications Developed By Organization) * (Average Number Of Vulnerabilities Per Production Application) * (Average Development Hours To Remediate Vulnerability In Hours) * (1 Year / 52 Weeks) * (1 Week / 40 Hours Worked) * (Average Annual Developer Cost)
- Security Analyst Costs = (Distinct Production Applications Developed By Organization) * (Average Number Of Vulnerabilities Per Production Application) * (Average Security TeamHours To Remediate Vulnerability Found In Production In Hours) * (1 Year / 52 Weeks) * (1 Week / 40 Hours Worked) * (Average Annual Security Analyst Cost)
- Expected Value Of Breach Cost = (Average Cost Of Data Breach) * (Likelihood Of Data Breach)
Model Parameters:
- Distinct Production Applications Developed By Organization: 17 [10]
- Average Number Of Vulnerabilities Per Production Application: 30.59 [11]
- Average Development Hours To Remediate Each Vulnerability Found In Development: 3.61 Hours [12]
- Average Development Hours To Remediate Each Vulnerability Found In Production: 10.71 Hours [13]
- Average Annual Developer Cost: $150,000
- Average Security Team Hours To Remediate Each Vulnerability Found In Production: 3.10 [14]
- Average Annual Security Analyst Cost: $100,000
- Average Mean Time To Remediate Vulnerabilities — Low Scan Frequency — 1–12 Scans Per Day (Shift Right Security): 217 Days [15]
- Average Mean Time To Remediate Vulnerabilities — High Scan Frequency — 260+ Scans Per Day (Shift Left Security): 62 Days [15]
- Assumed Reduction In Vulnerabilities By High Scan Frequency: 71% [16]
- Percent Of Data Breaches As A Result Of Application Vulnerabilities: 43% [17]
- Average Cost Of Data Breach: $4.35M [6]
- Base Likelihood Of Data Breach: 1.13% [7]
- Likelihood Of Data Breach With High Scan Frequency: 0.79% [18]
DevSecOps has some great supporting research surrounding the cost to fix security flaws at different stages of development (unit testing, integration testing, system testing, staging, production, etc.), so it was not surprising to see the dramatic differences of shifting left versus right in this model. There is really no excuse in 2022 to not be a champion of DevSecOps — that goes for all sizes of software development organizations (these organizations can be units within broader organizations).
Model 3 — Robust Employee And Asset Onboarding And Offboarding
Onboarding and offboarding of employees and assets are hugely underrated security workflows. Done right, it offers an opportunity to create clean data and guarantee strict control (EPDR, VPN, Email Security, disk encrypted, browser controlled by organization, etc.) and access states at onboarding and offboarding time. Done poorly, it creates extra work and leaves things to chance or human manual workflows. There are plenty of systems out there that help put rails on these processes. This model compares an organization with perfect security onboarding and offboarding, versus one with manual, error prone workflows.
Model Costs:
- Employee Onboarding Tool Setup Time Costs = (Organization Size) * (Organization Turnover Rate) * (Time To Manually Onboard IT In Minutes) * (1 Hour / 60 Minutes) * (1 Week / 40 Work Hours) * (1 Year / 52 Weeks) * (Average Annual Employee Cost)
- Billable SOC Costs = (Organization SOC Size) * (Average Annual SOC Analyst Cost) * (Applicable Efficiencies)
- Expected Value Of Breach Cost = (Average Cost Of Data Breach) * (Likelihood Of Data Breach)
Model Parameters:
- Organization Size (Constant For A Year): 10000 Employees (Users)
- Annual Organization Turnover Rate: 47.2% [19]
- Average Annual Employee Cost: $100,000
- Time To Manually Install And Configure EPDR and VPN On New Laptops: 20 Minutes [20]
- Organization SOC Size: 3 FTE
- Average Annual SOC Analyst Cost: $100,000
- SOC Efficiency Gains From Clean Mapping Of “Who Owns What”, As A Result Of Employee And Asset Onboarding: 10% [21]
- Percentage Of Data Breaches As A Result Of Phishing: 16% [22]
- Percentage Of Data Breaches As A Result Of Improper Employee Offboarding: 10% [23]
- Average Cost Of Data Breach: $4.35M [6]
- Base Likelihood Of Data Breach: 1.13% [7]
- Likelihood Of Data Breach With Guaranteed Correct Controls On Every Employee Laptop, And Automated Offboarding: 0.85% [24]
Humans make mistakes; keep the repetitive tasks to machines. Even if you assume in a task like onboarding and offboarding humans only make mistakes 5% of the time, that is 472 errors in this model accounting for all those employees onboarding and offboarding. That is a lot of low hanging fruit risk to take off the table. Invest in a robust tool that manages this for your organization, it will pay for itself.
Conclusions
Security is a complicated web of tradeoffs, shifting security left is no different. I mostly explored this analytical exercise because I can’t believe I’m still seeing alerts in the wild only ever possible because an organization is not implementing MFA. I get it though, the basics can be challenging, between battling legacy IT debt or bureaucracy. Whatever your role, hopefully this gave you some new ammunition on how “Shift Left Security” can drive business results and pay for any new tooling required from the economics alone.
Now go forth and eat your vegetables.


